
Introduction
In the north-west corner of Western Australia lies a narrow land mass, about 30 kilometres long and 6 kilometres wide, that is covered in a jumbled mass of red/black/brown weathered rocks piled upon each other to create steep, largely treeless, hills overlooking the Indian Ocean. This place was called Dampier Island by European settlers and named Burrup Peninsula in 1979, but traditional owners call it Murujuga, meaning ‘hipbone sticking out’. The location has special Aboriginal significance as a Dreaming place, a Law place and a landscape with a sorry history of colonial period massacres and ancestral dispossession . The rock art within the area is specifically treasured and comprises rock engravings or petroglyphs.
Murujuga has one of the world’s largest concentrations of rock art, with more than one million images. It is also among the oldest, with strong evidence that the long series of changing image styles and evolving fauna extends back at least 50,000 years . The rock art contains some of the earliest known images of the human face, complex geometric designs, extinct animals including the fat-tailed kangaroo and thylacine and it depicts an evolving change in fauna both before and after the glacial maximum. An application for World Heritage Listing for the area is well advanced.
A large section of Murujuga contains massive industries, including iron ore export infrastructure, a large sea-salt evaporation area, a natural gas processing plant, gas liquification trains, an ammonia fertiliser plant, and an ammonium nitrate facility. Together with the associated shipping facilities, this area is one of the largest bulk export ports in Australia. The development of industry since the 1960s has resulted in the physical destruction of hundreds of cultural features, and thousands of individual petroglyphs . As well as the massive carbon emissions that have drawn widespread environmentalist condemnation , this industry releases annually thousands of tons of nitrogen oxides, sulphur oxides and ammonia, and hundreds of tons of ammonium nitrate particles .
The nitrogenous substances stimulate adventitious microbial growth, which produce organic acids that can dissolve the rock surfaces upon which the rock art is engraved . Nitrogen and sulphur oxides also combine with rain and dew to form highly caustic acids that are similarly able to dissolve the rock surfaces .
Almost everyone today concedes that industry should never have been placed on Murujuga and that other less culturally and environmentally significant locations should have been utilised (González Zarandona Citation2020). However, decades on from the decision to locate industry here, and with tens of billions of dollars invested in infrastructure, we are stuck with an uncomfortable cohabitation of exceptional Indigenous heritage among entrenched industrial capitalism.
State governments have been successively compromised in their role as protector of the area’s heritage and as a promoter for sustainable development. The Western Australia State Government has funded the infrastructure upon which the industry is reliant, it has guaranteed industrial loans, and it has put in place some of the weakest and most poorly regulated pollution control measures in the developed world (Smith et al. Citation2022, p. 11). The state government’s development agency still advertises the area as a ‘well-established strategic industrial estate with vacant land for strategic industry’ . New industrial developments are currently in the process of gaining approval. Murujuga has become one of the world’s most contested landscapes; a test-case as to whether Australia will take the hard actions needed to deliver on its commitments to emissions reductions and a sustainable future. We have demonstrated elsewhere that pollution will damage the rock surfaces and the petroglyphs of Murujuga (Black, MacLeod, and Smith Citation2017; Smith et al. Citation2022).
As part of a series of independently funded studies into the impacts of industry on Murujuga rock art, in this paper we examine observable changes to a group of petroglyphs by comparing archival and recent photographs. This is the initial report of a long-term project that will monitor the extent to which signs of industrial impact are visible on the rock art at Murujuga. First, we provide background information on Murujuga rocks, petroglyph creation, and the ways industry can damage the rock art.
Murujuga Rocks and Petroglyph Creation
The rocks on Murujuga are extremely hard igneous types that crystallised under extremely high temperatures and pressures some 3.75 billion years ago (Donaldson Citation2011). The now exposed large flat surfaces on which the rock art sits were produced by tectonic forces and temperature changes over aeons. The weathering process of the rocks is described by Smith et al. (Citation2022). Newly broken blue/grey rock faces degrade extremely slowly, producing an orange/yellow coloured weathering rind with a thickness of 5–10 mm over around 30,000 years (Pillans and Fifield Citation2013). The outer surface of the weathering rind has a crust or patina providing the dark reddish-brown colouring to the exterior appearance of the blocks. In addition, there are both dull and glazed veneers across the rock surface. These thin (1–200 µm), hard outer accretions, known as desert or rock varnish are a ferromanganese crust partly formed by a biomineralization process, where specialised bacteria and micro-fungi concentrate, 50–300 times, manganese and iron from environmental dust to form a sheath for protection against the low moisture, high radiation, and temperatures of the rock surfaces (Dorn Citation2020). The iron and manganese-rich outer sheaths from the microorganisms are incorporated with clay from dust into the rock varnish when the organisms die. Fossils from bacteria and fungi have been observed in the varnish of rocks collected from the Pilbara region of Western Australia of which Murujuga is part (Flood, Allen, and Longazo Citation2003). These rock varnish-forming organisms remain dormant for most of their lives, becoming active only when conditions are sufficiently moist. Consequently, the rock varnish forms at an incredibly slow rate of 1–10 µm in 1000 years (Liu and Broecker Citation2000; Dorn Citation2009). The rock art is created by breaking through the rock varnish and into the exposed underlying pale weathering rind, which results in a colour and contour contrast.
How Murujuga Rock Art Can Be Damaged by Industry
There are three main ways that Murujuga rock art can be directly damaged by industry. The first is mechanical removal and damage during land clearance for industrial plants, roads, pipelines, power lines, water, sewerage, and storage areas. This damage is readily visible and, since the enactment of the Aboriginal Heritage Act in 1972, has been formally recorded at its time of original impact. Based on land area covered by industry, survey records and landscape features, it is estimated that some 10,000 petroglyphs have been destroyed or moved from their sacred location (although see Bednarik Citation2002, Citation2006b). José Antonio González Zarandona (Citation2020) has characterised this as ‘landscape iconoclasm’, the intentional act to dishonour an entire belief system and supersede Western economic values above Indigenous living spiritual values. He argues that the scarred industrial landscape of Murujuga, bulldozed for decades by industry, intentionally stamps visual confirmation that there are ‘victors and vanquished’ in this landscape (González Zarandona Citation2020, 210–17).
The second form of damage is that caused by the chemicals emitted by industry, in particular the deposition of acidic dust. When combined with water, these acids cause the dissolution of the manganese and iron compounds in the rock surface and, as these compounds erode away, the rock varnish and patina become increasingly fragmented, exposing the weathering rind and therefore appearing increasingly lighter in colour (Black, MacLeod, and Smith Citation2017). Eventually, high acid concentrations will completely dissolve the outer veneer as was found by Bednarik (Citation1979) in locations with extensive bird droppings and as is still observable today. Nitrogen emitted by industry also stimulates the growth of adventitious organisms that produce large quantities of organic acids (MacLeod Citation2005), further eroding the outer hard crust (Gadd Citation2017). Some of these organisms are visible in the form of lichens, algae, and other discolourations of the surface. Increased porosity of the rock varnish and patina after exposure to acids will facilitate the passage of acidic compounds and sea salts into the surface veneer/weathering rind interface and this process will weaken the bonds holding the outer hard crust to the rock. Crystallisation of nitrates, sulphates, and sea salts upon drying at this interface may lead to the visible flaking off and breaking down of the rock surface (Oguchi and Yu Citation2021; Pillans and Fifield Citation2013).
The final form of damage is the collateral damage from an increased unsympathetic human presence in the landscape. The desecration is seen in rock scratching from off-road vehicles and graffiti, broken rocks from inappropriate trampling, theft of rocks with petroglyphs, rock splitting and discolouration from non-traditional burning practices, damage from feral animals, and non-native plant infestations. Indirectly, the cultural and heritage values of the rock art are impacted by the noise, heat, and smell of industry as well as by the damage to the physical and spiritual fabric of the landscape and its viewsheds.
Methods
A photographic analysis was undertaken by comparing images from archival photographic collections dated from the early 1960s to early 1980s, when petrochemical industrialisation commenced, with more recent photographs taken over the last decades to 2021. Our analysis aimed to observe differences over time in rock flaking, spalling, scratching, and erosion. We were less concerned about the colour changes because, in many cases of the older images, the colour had been distorted considerably either by degradation of the original film or through the digitisation process. Lightening and darkening of surfaces are potentially amenable to analysis because sufficient images exist with black and white scales to allow valid comparison. Nonetheless, we are aware that the angle of the sun at the time of the photograph can shift the colour and surface texture appearance of the rock panel and petroglyph.
Archival Photographs
To allow for meaningful comparative analysis of changes through time, we began our work by digitising a series of archival photographic collections of petroglyphs and also brought together sets of more recent images that were either born-digital or were already digitised by others. The oldest photographic images of Murujuga rock art date back to the 1960s and 1970s when the iron export facilities, salt evaporation ponds, roads, and ports were being constructed. We used more than 800 photographs from the collection of the Archaeological Section and the Department of Aboriginal Sites, both now held at the Western Australian Museum. These included images taken by Patricia Vinnicombe, Robert Bevacqua, Warwick Dix, Peter Randolph, and Bruce Wright. We also analysed a set of images taken by Fulgenzio Leonardo (Enzo) Virili while working as a project engineer for Dampier Salt between 1970 and 1976 and that have been donated to the Western Australian Museum. We gained access to a number of important early private collections of photographs and slides. There was a partial collection of images (42) taken by Robert Bednarik between 1967 and 1970 when he worked as a project manager for an engineering firm based in Dampier and, in his spare time, recorded rock art. Bednarik holds his recordings in his private collection. Unfortunately, we were not able to digitise all of this important collection. There is a significant archival collection of Murujuga recordings made between 1974 and 1977 by the French archaeologist Michel Lorblanchet. We were able to access the sections of these recordings that have been made public but did not access the large collection of his materials held at the Australian Institute of Aboriginal and Torres Strait Islander Studies in Canberra. We were able to utilise the private collection of Sylvia Hallam, the pioneer Western Australian archaeologist based at the University of Western Australia. Hallam never undertook formal research at Murujuga, but she made private visits to the site in the late 1970s. A collection of 74 Hallam slides were provided to the project by the Honourable Robin Chapple.
These early collections of rock art images from Murujuga are extremely valuable because they show the rock art in its original state prior to the introduction of heavy polluting industry. The early iron and salt export facilities from the 1960s and 1970s, while bringing limited pollution from shipping, did not themselves introduce major issues from acidic pollution. The highly significant acidic pollution emissions only started in the 1980s with the processing of the natural gas and then the proliferation of associated facilities built to utilise the by-products of gas processing.
Selection of Archival Photographs for Analysis
More than a thousand photographs from the archival collections were examined to select the most suitable sites for our detailed photographic analysis. The first stage of this project concentrated solely on the oldest available archival collections. It was of prime importance to select a set of sites for which there were multiple ‘early’ and high-quality photographs. ‘Early’ for this project was defined as dating to the 1960s and 1970s. There are very few photographs of Murujuga that are older than this, and the few that exist are mostly landscape shots, rather than images of petroglyphs. It was important to choose images where the date of photography was known, at least approximately. We were not concerned if it could only be ascertained that an image was taken in the ‘early’ or ‘mid’ 1970s. This was sufficient for our purposes to place it within a known phase of industrial development. The exact location of the petroglyph was also necessary as we sought to compare sites that were both closer and further away from industrial areas.
The second stage of the project was to identify petroglyphs for detailed analysis. This project only focused on petroglyphs on the peninsula and did not include sites on the surrounding islands. In selecting sites for analysis, we sought a sample that covered a wide spread of the Murujuga landscape, both comparatively close and far from industry and that had sufficient photographic coverage from the 1960s and 1970s to allow for comparative study. A sampling area was chosen near to the gas processing plants south of Withnell Bay and that has been heavily exposed to industrial emissions since the mid-1980s. Another area was chosen near to the Yara International ammonia fertiliser and ammonium nitrate plants and that has been more exposed to emissions since 2006 and 2017, respectively. A final area was chosen in the southern part of the peninsula, further from the industrial plants, but that has been exposed to varied aspects of the salt-working industry since the 1970s. Every petroglyph in these areas with long spans of photographic coverage from the 1970s to the present was selected. The final overall sample contained 26 petroglyphs (see Figure 1); of these 10 were on gabbro, 15 on granophyre and 1 on dolerite rock types. An extensive and varied set of older images was amassed for each selected petroglyph.
Figure 1. Map of Murujuga showing the approximate locations and rock type of the analysed petroglyphs. Green circles are monitoring sites on gabbro rock, red circles are monitoring sites on granophyre rock, the yellow circle is a monitoring site on dolerite rock.
Recent Images of Selected Petroglyphs
More recent images of the selected petroglyphs were then sought. This task was considerably more cumbersome than it sounds because most of the site names, even broader locality names, have changed over time and the bulk of the images had to be found via manual visual browsing through the thousands of digital images stored in the more recent collections. Images of all selected sites taken in the 1980s, 1990s and 2000s were then added to the site files for comparative purposes. Images of Murujuga rock art taken post petrochemical industrialisation are far more extensive than older images. The Centre of Rock Art Research + Management (CRAR+M) of the University of Western Australia contains tens of thousands of images taken over the last 15 years by Professor Jo McDonald and her team which included Rio Tinto colleagues. This collection provided many high-quality recent images for the photographic analysis. Other recent collections used were the Dr Ian MacLeod Private Collection and the Robin Chapple Private Collection. Additional photographs were provided for selected sites by Drs Benjamin Smith, Mike Donaldson and Ken Mulvaney (it should be noted that both Donaldson and Mulvaney have also donated many tens of thousands of images to the CRAR+M collection). We then returned to every one of the 26 selected sites in July 2021 to take a full set of contemporary images.
Image Analysis
The early archival photographs of these 26 sites were edited using Adobe Photoshop. This work adjusted the brightness, contrast, exposure and levels of RGB channels to bring maximum clarity and visibility to the images under study. We also produced a set of colour-calibrated and standardised images, as far as was possible, for the purposes of comparison. These enhanced and standardised images were subsequently used alongside the original images. There was therefore no loss of image information, only the creation of varied sets of images, each with their own uses for optical analytic purposes. All versions of images from a single site were stored together in digital folders and these have been retained for future analyses, including for petroglyphs not able to be analysed here.
The final stage of the work involved the use of pairs of images (old and new) for comparison on large format, high-resolution screens. Identified differences between images included cracks, flaking, spalling, scratching, lightening or darkening of the surface, lichens and other visible biological changes, and any removal or shifting of adjacent rocks. The work did not include colour spectral change analysis since the archival images were photographed with different types of film, and then digitised using different digital processes which has greatly impacted replicating the original colour. We were, however, able to see when a surface had significantly lightened or darkened. For the purpose of analysis, each rock was divided into zones and magnified to the highest level possible before pixilation and then compared side-by-side. Multiple old and new images, taken from different angles, were used to ensure that all details were observed and compared. Every crack, flake, lichen, and other analysed aspect was examined at maximum magnification to see if it had expanded or been altered in any visible way. Where possible, changes in the surrounding rocks and hillsides were also recorded. All visible changes, no matter how small, were noted.
Results
The findings from the analysis of the 26 engraved rocks (Figure 1) show a number of changes, some prominent, others relatively minor. We present these changes now by category. It is important to understand that the rock art of Murujuga has only been subject to acidic pollution for about four decades and the extent of acidic industrial pollution has tripled over recent decades (Smith et al. Citation2022). Any change in visible condition within this relatively short timeframe will indicate an alarming rate of rock decay and a cause for grave concern about the long-term preservation of the art.
Petroglyphs Showing Flaking and Major Change
Two of the 26 petroglyphs show extensive evidence of flaking and major observable change.
Petroglyph #16
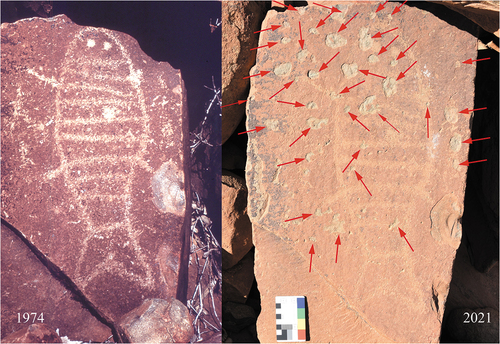
An image of a fish, the petroglyph located towards the southern end of the peninsula shows radical flaking of the outer crust (Figure 2). In 1974, there was a relatively fresh flaking scar at the centre right, two areas of minor abrasion over the top right quartile of the fish, and a few minor scratch scars spread across the surface. A recent photograph taken by this project in 2021 clearly indicates radical condition change. The scars that were visible in 1974 are still visible but have patinated and are less visually prominent. Importantly, more than 30 areas of surface veneer now display new flaking, exposing the weathering rind that was not visible in the 1974 photograph. The flaking is both over and beside the fish petroglyph. A photograph taken by Ken Mulvaney in 2009 shows the full extent of flaking seen in the 2021 image. This means that this flaking occurred rapidly between 1974 and 2009 but has since slowed, perhaps stopped. The rock is located towards the base of a steep hillside and is immediately adjacent to a gravel road. Other rocks in the immediate vicinity show similar flaking, although not as extensive. For 30 or so years, beginning in the early-1970s this road was used by open-topped haulage trucks to transport salt to the ship-loading jetty on Mistaken Island. In 2003, the truck haulage along this stretch of road was replaced by an automated conveyor-belt system that continues to be used today. The flaking seems to date to the period of the road haulage. The most probable explanation is that the flaking was caused by salt that had fallen or blown off the trucks, onto the road, and which was then thrown up as road dust onto the rocks of the lower hillside on which this petroglyph is located.
Figure 2. Petroglyph #16. Extensive flaking is visible around and over this fish petroglyph that was not evident in the 1970s. Left is a scanned slide by the Aboriginal Sites Department 1974. Right is a born digital image by B.W. Smith 2021. The red arrows show flaking of the rock varnish not evident in the 1974 image. Note that the top right corner of the rock is concealed by shadow in the 1974 image.
Petroglyph #1
Petroglyph #1 shows clear evidence of increasing blackening of the surface through recent decades (Figure 3). This blackening goes against the findings at our other sites, which, if any colour change was noted, showed lightening through time, supporting the findings of Black and Diffey (Citation2016). The blackening of this particular surface is occurring both over and around the petroglyph. Early photographs taken in 1981 and 1987 show no visible blackening on the surface. A 2009 photograph by Robin Chapple shows early evidence of blackening but without the intensity seen in 2019 and today. This panel is 630 m away from one of the larger Karratha Gas Plant flares and is in one of the areas most exposed to industrial pollution. The blackening of this surface is therefore highly likely to relate to industrial activity and needs to be properly investigated. It is important to note that the most recent photographs since 2019 also provide evidence that the rock varnish is starting to break down in the blackened area. There are distinctive and new lighter orange marks immediately above and to the right of the head of the petroglyph caused by a breakdown of the surface crust (Figure 4).
Figure 3. Petroglyph #1. This site is located close to industry. It is showing increasing evidence of blackening through time. In all three images, scales allowed for black and white calibration and therefore confidence in the observed blackening. Left is a scanned slide by P. Vinnicombe 1981. Centre is a born digital image by R. Chapple. Right is a born digital image by B.W. Smith 2021. Culturally sensitive image blacked out by request of Murujuga Aboriginal Corporation.

Figure 4. Petroglyph #1. Left image shows proximity of location to industrial emissions towers. Red circle in right image highlights area in which the darker rock varnish is starting to break down. Left image by B.W. Smith 2021. Right image by K. Mulvaney 2019. Both born digital. Culturally sensitive image blacked out by request of Murujuga Aboriginal Corporation.

Petroglyphs Becoming Lighter
Nine of the analysed petroglyphs provide indications that they are becoming lighter (#2, #5, #6, #9, #16, #17, #21, #22, #24). Definitive evidence of colour change is difficult because the earlier comparative photographs up until the 1980s were taken on colour slide film. These older colour slides, particularly many that were taken using Agfa film, have discoloured significantly becoming more purple, blue, and dark (e.g. Figure 11, left). This change has sometimes been exacerbated in the digitisation of the original slide. As an example, we provide an image taken by the Aboriginal Sites Department in 1973 of petroglyph #22 that has been digitised on a Nikon CoolScan, alongside a standard digital image taken with a Nikon D3100 camera in 2021 (Figure 5). The immediate impression is that petroglyph #22 is now much lighter and redder, with less contrast between the petroglyph and rock surface. However, some of this impression may be a product of the discolouration of the original slide. Whether all of this impression is a product of the discolouration of the older image seems unlikely, but it requires further study for us to be certain. A second example (Figure 6) on a nearby rock, petroglyph #21, seems to be a more clear-cut example of becoming lighter.
Figure 5. Petroglyph #22. Left image is a scan of slide by the Aboriginal Sites Department 1973. Right is a born digital image by B.W. Smith 2021. No colour adjustment.
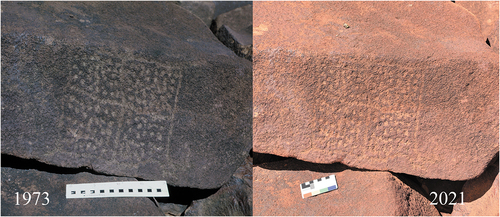
Figure 6. Petroglyph #21. An example of probable lightening. Left image is a scan of a slide by P. Vinnicombe 1988. Right is a born digital image by B.W. Smith 2021. No colour adjustment.

In one fortunate example (petroglyph #17) we have a long series of early images, with photographs in each decade from the 1970s to the present. This allows a clearer observation of colour change through time. In this case, it is apparent that the rock art and surrounding rock surface has lightened and that at least part of the colour change evident from early slides is a genuine colour change on the rock. Unfortunately, this rock cannot be illustrated due to Indigenous cultural protocols.
Petroglyphs Showing Mechanical Damage
Petroglyph #26
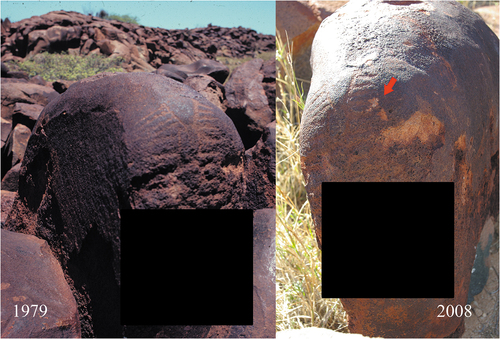
One petroglyph (#26) shows substantial mechanical damage from being moved. Two scars are now evident on the upper surface that were not present when this rock was photographed in its original location in 1979 (Figure 7). This petroglyph was moved during the original construction phase of the Karratha Gas Plant. It was mechanically lifted onto a truck, moved, and placed alongside hundreds of other salvaged rocks in a controversial holding enclosure near to Hearson Cove, known to locals as the ‘rock art prison’. The ‘prison’ has now been dismantled and this rock art has been relocated, under the supervision of Murujuga Aboriginal Corporation, to a culturally appropriate hillside location that is not disclosed to the public.
Figure 7. Petroglyph #26. New scarring visible made during physical relocation of rock due to industrial development. Left image is a scan of slide by P. Vinnicombe 1979. Right is a born digital image by R. Chapple 2008. Culturally sensitive image blacked out by request of Murujuga Aboriginal Corporation.
Petroglyph #11
Petroglyph #11, a kangaroo, shows a precisely square abrasion at the centre of the top back line in all photographs since 1991. This abrasion was not visible in an early image from 1970 (Figure 8, left). The mark remains visible today. The purpose or cause of the mark is not clear, but it was human-made either by mechanical or chemical abrasion.
Figure 8. Petroglyph #11. Images show the appearance of square abrasion in the centre of the backline of this macropod after 1970 (marked by a red arrow). Left image is a scan of slide by Aboriginal Sites Department 1970. Right is a born digital image by Mulvaney 2013.

Petroglyphs Showing Other Forms of Human Interference
Petroglyph #2
At petroglyph #2, four small unengraved rocks that were leaning up against the engraved block have been removed since 1980 (not shown for cultural reasons). These were partially obscuring (and presumably protecting) the lower left-hand corner of this large geometrically engraved block. It seems most likely that this removal was done by somebody photographing the rock. The cultural significance of these four rocks is unknown, but it should not be assumed that they had no significance. The shifting of rocks in this manner, without permission, is deemed unacceptable by the Murujuga Aboriginal Corporation.
Petroglyph #7
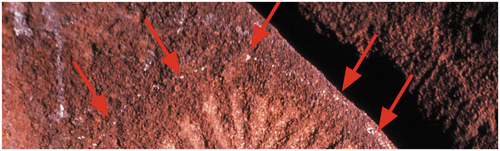
An early 1970s photograph of petroglyph #7 shows white lines and marks above the top of the image (Figure 9). These marks are either chalk lines or, more likely, residue from someone making a silicone peel of this petroglyph for the purposes of casting. Silicone peel casting destroys the dating potential of a petroglyph and is not permitted in most countries today. The white marks were not observable in images from 1991 and are not visible at the site in 2021. Whatever the cause of this residue, it has now been eroded from the surface.
Figure 9. White chemical residue around the top of petroglyph #7 (indicated by red arrows). Image is a scan of a slide by S. Hallam late 1970s.
Petroglyphs Showing Apparent Natural Changes
Petroglyph #13
Early 1970s photographs of petroglyph #13 show two distinct white spots in the lower portion of the panel. These spots remained evident in a 1996 photograph, but were not visible in 2004 and subsequent images. Observation of the site in 2021 found that similar white spots were still evident, but in new locations on the surface. High-power on-site investigation revealed that these were minute desiccated spider webs and so do not represent any material damage to the surface.
Petroglyph #8
Petroglyph #8 had a dark mark across the back and legs of the fourth bird to the right in a 1988 photograph, which appeared to fade over time (Figure 10). However, closer examination of the site reveals that the mark is a natural shadow due to an undulation in the rock surface and the intensity of the apparent mark changes with the angle of the sun. There has been no condition change at this site.
Figure 10. Petroglyph #8. Images provide the incorrect impression of a dark mark that is fading (indicated by red arrows). Left image is a scan of slide by P. Vinnicombe 1988. Right is a born digital image by B.W. Smith 2021.

These two examples emphasise the importance of careful on-site inspection to cross-check the findings from archival image analysis, and the worth of matching time of day and photograph angle.
Petroglyphs Showing Signs of Re-Patination
Petroglyph #16
Petroglyph #16 (see Figure 2) shows signs of probable re-patination over a period of approximately 50 years. The colour distinction between the background rock and the scar to the lower middle right of the rock has diminished between 1974 and 2021. Similarly, the contrast between the petroglyph and other marks on the rock in the 1974 photograph is less visible in the most recent photograph. Additional investigations will be required to confirm the apparent colour change with matched angle of sunlight at the time of the photograph.
Petroglyph #9
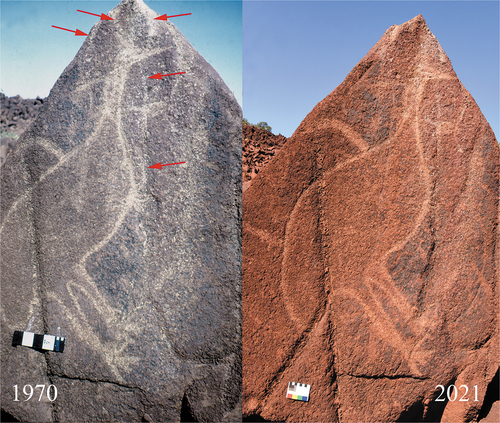
Petroglyph #9 (Figure 11) shows an emu petroglyph from the southern section of the peninsula. Despite being a discoloured digitised slide, the left image from 1970 shows a highly visible scar on the top of the rock and several visible lines running downwards from the top and around the head and neck of the bird. While the lines are still visible, they have become less pronounced over time, suggesting that some re-patination has occurred.
Figure 11. Petroglyph #9. Various lines around and below the head of an engraved bird (indicated by red arrows) are less visible today than in the past, suggesting re-patination. Left image is a scan of a slide by Aboriginal Sites Department 1970. Right is a born digital image by B.W. Smith 2021.
Petroglyphs Showing No Changes
For 13 out of our sampled 26 petroglyphs there was no evidence of a visible change over time from the early archival photographs to the most recent images (#3, #4, #8, #10, #12, #13, #14, #15, #18, #19, #20, #23, #25).
Discussion
A comparison of observable physical changes to rocks containing petroglyphs from pre- and early-industrialisation (mid-1960s), to more recent times, is seen as one way of assessing whether the presence of industry on Murujuga has accelerated the weathering process of the rock art. In searching for petroglyphs that had archival photographs extending over multiple decades, we were aware that it would likely be the larger, more well-known, more accessible petroglyphs and those surveyed due to the presence of industry that would be included for assessment. These sites are likely to be the more visited locations and will inevitably be the places that show greatest evidence of visitor damage. However, most of the damage to petroglyphs that we have recorded through the photographic record appears to have been caused not by visitors, but by changing physical conditions, likely a consequence of industrial activities.
Two rocks of the 26 petroglyphs examined were shown to have major, and likely irreversible, changes that have already damaged the petroglyphs on those rocks. Both rocks are in close proximity to industry. Petroglyph #16 is near the solar sea-salt haulage path, while petroglyph #1 is approximately 630 m from one of the larger petrochemical industrial flares. Acidity of rock surfaces in this area has increased over a thousandfold following industrialisation (Black, MacLeod, and Smith Citation2017; MacLeod and Fish Citation2021). There are eight potential examples (petroglyphs #2, #5, #6, #9, #16, #21, #22, #24) and one definite (petroglyph #17) example of petroglyph panels turning lighter over time, as is predicted with increases in rock surface acidity (Black, MacLeod, and Smith Citation2017). Of these, seven out of nine are close to industry. Petroglyph #26 has scars from being physically relocated during an industrial expansion. Thus, the petroglyphs showing the greatest damage are those most directly impacted by the major industrial complexes.
Effect of Salt
Examination of the rocks surrounding the damaged fish image (petroglyph #16), show clearly that many other rocks at a similar elevation and near to the salt haulage road have evidence of surface spalling (Figure 12). A few metres up the hillside, the spalling reduces and on the upper section of the slope, there is no visible spalling on the rocks despite the geology being identical.
Figure 12. Petroglyph #16. Fish at lower left. Similar spalling visible on adjacent rocks at the same height. Notice proximity to the salt haulage road and conveyor belt. Image is a born digital image by B.W. Smith 2021.

Sea salt spray has been known for centuries to cause weathering and deterioration to stone buildings, monuments, natural rocks, and other engineered masonry structures (Oguchi and Yu Citation2021). The mechanisms by which salt damages these structures are now well understood (La Russa et al. Citation2013; Oguchi and Yu Citation2021). Liquid salt water penetrates the structures through pores in the surface. The salt water does relatively little damage provided it remains in liquid form. However, damage occurs when the water evaporates allowing salt crystals to form. Water enters the rock through pores and, when the rock is subsequently heated, the water then evaporates through these same pores. This leaves behind the salt in the form of crystals within the rock pores. As these crystals expand, this creates pressures within the rock that exceed its tensile strength, causing cracks and fissures to develop through time until eventually the rock surface layer exfoliates. The warm and dry climate of Murujuga is an exacerbating factor for this weathering process. Damage to petroglyph #16, where large sections of the surface crust have exfoliated, suggests that the increased salt levels are causing the comparatively weak bonds between the veneer and the weathering rind to break down, causing significant flaking and erosion into the weathering rind. This rock remains a cause for concern although the photographic evidence suggests that the immediate industrial threat to this petroglyph has diminished since the installation of the salt conveyor belt (Figure 12).
Degradation Due to Increased Acidity
There are eight potential and one diagnostic example of lightening in the colour of rocks examined. In other countries, there are examples of petroglyph panels becoming lighter due to dust settling on the rock and becoming bonded into the rock surface (Kloor Citation2008). We have examined all of the eight surfaces, and this is not the cause of change at Murujuga. We have strong evidence that this colour change is caused by acids that are changing the chemical composition of the rock varnish and surface patina (Smith et al. Citation2022). Many thousands of tons of nitrogen dioxide and sulphur dioxide are released from industrial processing facilities and to a much lesser extent shipping, into the Murujuga airshed annually (Smith et al. Citation2022). Around 35% of nitrogen dioxide released is deposited on the Murujuga rocks (Woodside Citation2019). These dry acids react with water from light rain and dew to form strong nitric and sulphuric acids. These acids, along with increases in organic acids produced by microbial growth stimulated by industrial discharged nitrogen, have resulted in a marked increase in the acidity of the rock surfaces, particularly near the natural gas processing facilities. Rock surface pH in this region of Murujuga has been shown to fall below 4.0 in 2017 (MacLeod and Fish Citation2021). Natural acidity of the rock surfaces prior to industrialisation was near neutral (Bednarik Citation2002). The increase in the acidity of the rock surface causes the darker iron and manganese oxides and hydroxides in the rock varnish to dissolve, as well as etching into the weathering patina, making the rock surfaces lighter and redder in colour as the iron compounds become dominantly ferrous oxide before being completely dissolved (Black, MacLeod, and Smith Citation2017). Given the level of increased acidity, the probable lightening of eight surfaces is not surprising and is a cause for concern. Nevertheless, this suspected colour change identified on several petroglyphs requires verification of the cause through detailed microscopic and chemical analyses of the rock veneers across the rock surfaces. As the project has been reliant on photographic images, it will also be important to rule out potential natural factors such as the angle of the sun, time of day and time of year, as well as surface moisture at the time at which the photograph was taken.
Other Damage
The unusual blackening of petroglyph #1 could have a number of causes. It could be soot blackening from the smoke of the industrial gas flares (Figure 13), or it may be the residue of a microbial explosion caused by the industrial nitrogen-rich deposit. Whichever, this requires further investigation and, most alarmingly, it seems to be causing destabilisation of the rock varnish.
Figure 13. Black smoke from the natural gas flaring towers. Image by R. Chapple 2017.

Two rocks have evidence of mechanical damage, one caused by the physical relocation of the rock to clear land for industry (petroglyph #26; Figure 7) and the other by intentional human-directed actions (petroglyph #11; Figure 8). Whilst there were no incidences of graffiti or vandalism in the selected sample, there are incidences of this at Murujuga (Figure 14), especially around the industrial areas and these are increasing as more outsiders come to work in and/or visit the area. Disrespectful behaviour towards Indigenous heritage in these areas is evident from the shooting at and removal of heritage protection signage, the intentional toppling of standing stones and the driving of off-road vehicles over and through sites of great Indigenous cultural significance.
Figure 14. Graffiti near industry at Murujuga. Image by R. Chapple 2005.

Re-Patination
There was evidence of re-patination on the rocks associated with petroglyphs #16 (Figure 2) and #9 (Figure 11). Neither of these two petroglyphs are in close proximity to those industries producing acidic pollution. They are both in the southern section of the peninsula. To our knowledge, rock surface acidity has not been measured on rocks associated with these petroglyphs. Assuming the pH of the rock surfaces in this area is near neutral or slightly alkaline as in the pre-industrial environment, it may be possible to observe some slight re-patination over 50 years. On stable surfaces in desert environments re-patination has been recorded at a rate of 1–10 µm in 1000 years (Liu and Broecker Citation2000; Dorn Citation2009). If we took the higher end of this rate and assumed it to be growing in Murujuga at the rate of 10 µm in 1000 years, re-patination of 0.5 µm would be possible in 50 years and likely be visible.
Conclusions
This comparison of pre- and early industrialisation photographs of 26 petroglyphs on Murujuga with recent photographs was undertaken as one means of assessing whether the presence of industry is accelerating degradation of one of the world’s most significant rock art galleries. The analysis showed that only 13 of the rocks are showing no indication of change, with 2 showing evidence of re-patination (petroglyphs #9 and #16). This means that half the petroglyphs examined are showing either diagnostic or potential symptoms of damage. The majority of these changes appear to be caused by industrial activity in the area. All petroglyphs showing alteration, with the exception of the probable silicone peel and the abraded square, are within close proximity to industrial activities. The silicone peel and the abraded square were likely the product of past research activities rather than intentional vandalism. However, 5 (#3, #4, #18, #23, #25) of the 15 that show no change were also within close proximity to industry. Interestingly, most of these were on more elevated and vertical surfaces. It may be that vertical surfaces are more protected from the effects of industrial pollution than surfaces on which airborne substances can accumulate more easily. Ongoing assessment of these petroglyphs is needed to identify whether changes that are not yet visible will emerge.
We intend to record through photography our analysed petroglyphs sites every 10 years. As this image database grows, it will provide a vital resource to map the impact of industrial pollution and other factors on the rock art of Murujuga. The work reported here is a start to this long-term study. As we digitise a larger section of the early recordings of rock art from Murujuga, we hope to add additional sites to the list of those included in this analysis. Our intention is to provide long-term support to the Murujuga Aboriginal Corporation in its efforts to protect the Indigenous heritage of the area.
Reporting these observations now is at an important moment in time because there is significant pressure on industries worldwide to reduce their industrial emissions. If emissions are reduced swiftly at Murujuga, the evidence presented in this paper suggests that damage to the rock art may be limited and this extraordinary place can remain largely intact for future generations.
Acknowledgements
The authors thank Natalia Podhajska for her work on analysing changes in the archival images and the Murujuga Aboriginal Corporation for their support. We thank two anonymous reviewers whose recommendations improved the paper. We thank the Honorable Robin Chapple and Drs Ian MacLeod and Mike Donaldson for the photographs they provided. We are grateful for the institutional support that we receive from the Centre for Rock Art Research + Management in the School of Social Sciences at the University of Western Australia and the large photographic library developed by Professor Jo McDonald. The authors are committed to conducting research that inflicts no new damage to the rock art, archaeology, environments, living cultural values, and viewsheds of Murujuga. This publication is produced as a part of the Murujuga Rock Art Conservation Project. The views expressed in this paper are our own and may not reflect the views of those who have supported our research.
Disclosure statement
No potential conflict of interest was reported by the authors.
Correction Statement
This article has been republished with minor changes. These changes do not impact the academic content of the article.
Additional information
Funding
This project was partly funded by the Gordon Darling Foundation and by ordinary citizens who gave an amount in excess of AU$330,000 through crowdfunding. This extraordinary level of public support shows the extent of public concern that exists on this topic. We thank each of the many hundreds of people that supported this research.